
Economic Outlook
GDP
The U.S. economy continues to defy expectations in the face of high-interest rates. Economic growth in the first quarter of 2024 is projected by the Atlanta office of the Federal Reserve to come in at an annualized rate of 2.4%. This is a slowdown from the unusually strong 3.4% rate in the 4th quarter of last year, but remains above the long-term trend rate of about 2% growth we’ve experienced over the last 25 years. This is particularly notable given the high prevailing interest rates that were expected to significantly slow the economy or even push the country into a recession.
The main driver of this growth continues to be household spending, which increased at a 2.6% annualized rate during the quarter. With spending growth far exceeding income growth, all but the highest income households have generally drawn down excess savings and are increasingly reliant on credit. Credit card and auto loan delinquency rates now exceed pre-pandemic levels. This combination of factors suggests that consumer spending, and thus the overall economy, should slow in the months ahead.
*Notes. The current GDP estimate is the March 31st GDPNow figure from the Atlanta branch of the Fed. Other 03/31/2024 data is from the latest available release, which may be from the prior month. Fed Funds rate is the lower end of target range
CCM Key Economic Indicators
Indicator
3.31.24*
12.31.23
3.31.23
U.S. Economy
Quarterly GDP Growth
Est 2.4%*
3.4%
2.2%
Unemployment Rate
3.8%
3.7%
3.5%
U.S. CPI (Core)
3.8%
3.9%
5.0%
Interest Rates
Fed Funds Rate
5.25%
5.25%
4.75%
10-Year Treasury Rate
4.21%
4.02%
3.66%
Currency & Commodities
Crude Oil (WTI)
$83.96
$71.89
$75.68
Gold Price
$2,207
$2,062
$1,978
Trade Weighted Dollar
121.0
120.2
121.8
Confidence
Consumer Confidence Index
104.7
108.0
104.0
ISM Purchasing Managers Index
50.3
47.1
46.5
Stock Prices
Dow Jones Industrial Average
39,807
37,689
33,274
S&P 500 Forward P/E ratio
21.0
19.5
17.8
Inflation
Rising commodity prices, robust consumer demand and a solid labor market have stymied the downtrend in inflation. This is dimming hope that the U.S. can achieve its 2% target without some degree of economic growth sacrifice. It also shows that the Federal Reserve was wise to be cautious in signaling that interest rate cuts were imminent. The first interest rate cut could be as soon as June.
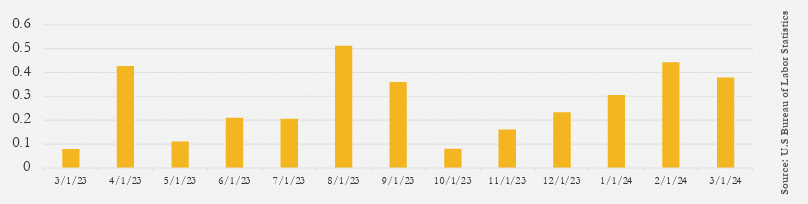
Inflation on a year-over-year basis remained fairly steady, with the headline rate of annual inflation increasing from 3.3% in December to 3.5% in March, and core inflation (excluding food and energy prices) dropping from 3.9% to 3.8%. What is more concerning is the upward trend in monthly rates of headline inflation for the last six months, as highlighted in the chart below. Despite these concerns, high interest rates, a cooling labor market and a slowing economy should combine to slow inflation over the coming quarters.
US Consumer Price Index Monthly Change (Headline Inflation)
Interest Rates
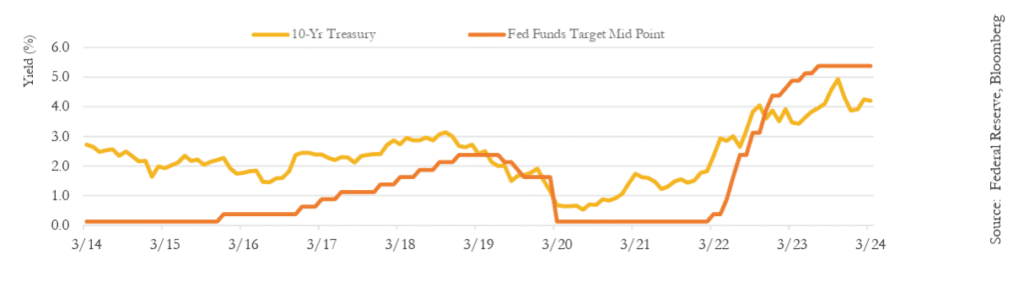
The Federal Reserve believes that inflation will return to its 2% target, which will likely be achieved later than originally expected. Until recently, the Fed was generally expected to vote to begin cutting rates at its June 12th meeting and to reduce the Fed funds rate by 50-100 basis points (.5% to 1%) over the remainder of the year. However, with monthly inflation rates surprising to the upside during the first quarter, this is likely to be delayed, and there is a small but growing possibility that the Fed could even raise rates again. Longer-term interest rates reflect this changed outlook, with the 10-year Treasury rate increasing from 4% to 4.2% during the quarter (and to 4.5% by mid-April).
10-Yr U.S. Treasury Yield vs. Federal Funds Target Rate
Labor Market
Monthly Change in Non Farm Payrolls (Jobs)
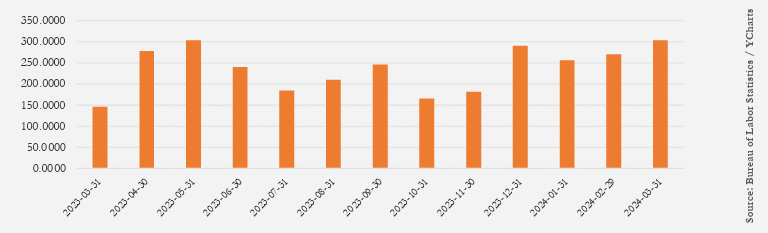
The total number of non-farm payroll positions continued to grow steadily during the quarter, with 300,000 new jobs added in March. Underneath the recent strength, however, lies widespread signs of the job market softening. The unemployment rate rose to a two-year high in February of 3.9%, before ticking down to 3.8% in March.
The latest readings on hiring plans, job openings, and the use of temporary workers all suggest that the demand for workers is easing. A more subdued hiring environment will likely lead to the unemployment rate continuing to increase this year, which should reduce upward inflation pressure from wages. However, the current strength of the labor market does support the Fed’s patience in lowering rates.
Housing Market
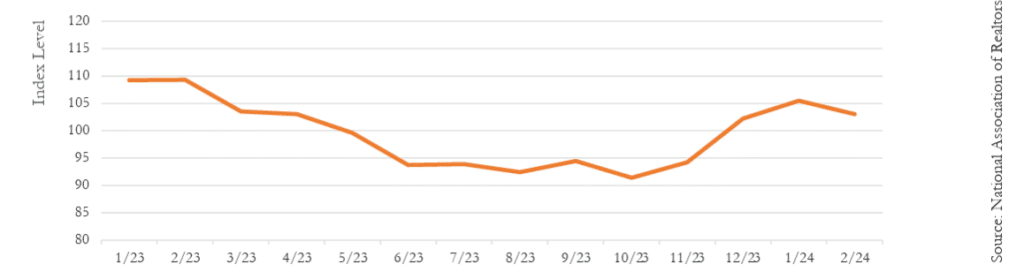
The affordability of the housing market rises and falls with interest rates. When mortgage rates declined in the second half of last year, housing affordability improved. But with the recent change in outlook on Fed policy and longer-term rates heading back up, affordability began trending downward. This seems likely to continue until the Fed rate cuts seem more imminent.
Buyers are expected to continue to flock to the new home market, where availability and affordability are smaller hurdles. As a result, new single-family construction should continue to march higher over the coming year, while multifamily development will likely lag. This has already been seen in the recent pullback in multifamily permits.
Housing Affordability Index
US Dollar
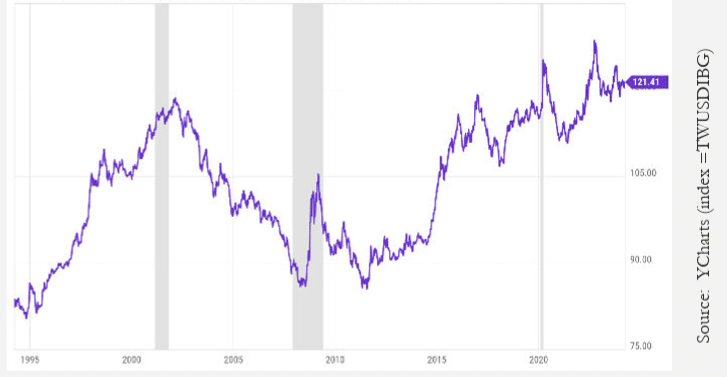
As illustrated in the chart to the right, the U.S. dollar has trended strongly upwards versus a basket of foreign currencies over the last 30 years. Although the dollar has remained volatile, it ended relatively unchanged in both the past quarter and the past year. Until Fed policy shifts toward rate cutting, the U.S. dollar is expected to remain relatively strong. However, once that occurs, interest rate differentials would mostly likely begin to favor foreign currencies. Keeping an eye on individual countries’ economic growth differentials throughout the year will also be important. If US economic trends worsen and other major economies recover, that would also lead to dollar weakening. Inflation also plays a role. The higher inflation is in the U.S. relative to other countries, the less attractive it is for investors to hold dollars and the more the dollar would be expected to fall. These factors lead us to expect modest weakening of the dollar over the next year.
Trade Weighted US Dollar Index: Broad, Goods and Services
The Global Economy
The global economy is expected to experience growth of around 3.0% in 2024, only a modest slowdown relative to last year. Among the advanced economies, Europe’s growth is underwhelming and expected to be subdued in 2024. In Japan, a technical recession has been revised away, but activity remains lackluster. In the G10, the U.S. economy continues to outperform and be the relative shining star of the advanced economies.
Emerging market economies, on balance, have proven more resilient than their G10 peers, except for the U.S. China’s secular slowdown, which appears to be continuing. In contrast, India’s economy continues to show promise and could grow over 7% this calendar year. Mexico’s economy continues to benefit from strong U.S. economic trends and is expected to continue growing. This year, emerging economies are expected to contribute the most to global GDP growth.
China’s economy is still on track to slow down from 2023, reflecting the ripple effects of the overbuilt conditions in the housing market. The government has set a 5% target for real GDP growth in 2024. Previously announced stimulus measures should help growth this year, but this will only be a short-term fix absent fundamental structural reforms. China’s economy will continue to struggle with its long-term growth prospects. In the meantime, excess capacity in China’s good-producing sectors is lending a hand to cooling global inflation, offering a timely offset to the rise in shipping costs from the conflict in the Red Sea.
Global Outlook
Growth prospects worldwide are on diverging paths. Relative to expectations, the US has been outperforming most other economies. However, as 2024 progresses, this script may flip. Slower U.S. consumer spending should lead to subdued U.S. economic activity, while foreign economies currently in recession or experiencing modest growth should be in recovery mode in the latter quarters of 2024.
Diverging growth prospects should also lead to diverging monetary policy paths. Central banks will likely move at differing speeds when considering pivots to easier monetary policy. Receding inflation and weak growth could make the European Central Bank one of the earliest major G10 institutions to lower policy rates.
Market Outlook
Overview
With the notable exception of China, stock markets around the world generally posted strong first-quarter returns which added to the substantial gains achieved in 2023. While bonds also performed well in 2023, valuations mostly dipped in the first quarter of 2024 as rising inflation fears pushed long-term rates higher. The U.S. stock market responded enthusiastically to the unexpected resilience of the domestic economy and its labor market, despite the headwinds of still elevated inflation and highinterest rates. While many investors expected the Federal Reserve to begin cutting interest rates by now, the Fed appears in no rush to cut rates in the face of solid economic performance. It remains concerned that rate cuts now would slow the reduction of inflation to targeted levels.
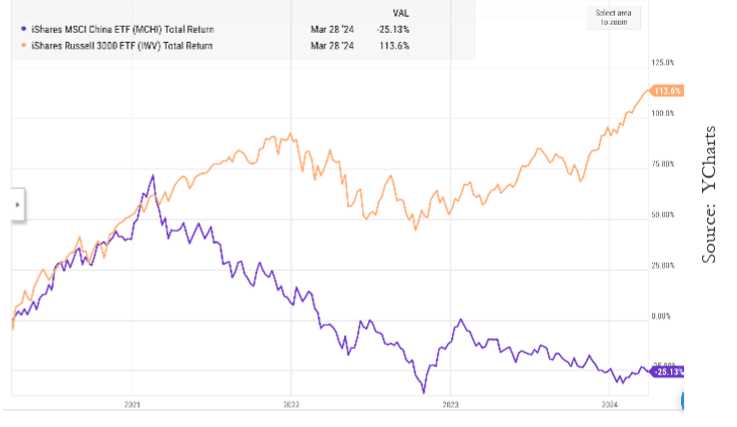
MSCI China ETF vs. Russell 3000 ETF (Over Four Years)
Equities
U.S. stocks across the capitalization and style spectrum delivered robust gains in the first quarter. Every capitalization and style type posted gains for the quarter. In a continuation of recent form, growth-style stocks, outpaced value stocks. The S&P 500 was up 10.3%, the Russell Mid Cap Index was up 7.9%, while Small-Cap stocks were up 5.2% in Q1. International stock markets, as measured by the MSCI All Country World Index (ex U.S.,) rose 4.7%. While this represents a considerable range of returns, all were well above historical averages. The MSCI China index was the outlier, falling 2% for during the quarter and 18% in the last year. This continued a multi-year trend of underperformance in the Chinese stock market. The cumulative four-year performance of the MSCI China ETF is compared to the Russell 3000 ETF (which tracks the broad US market) in the following chart.
Bonds
Bond prices generally fell during the quarter in the face of rising long-term interest rates. The yield on the benchmark 10-year U.S. Treasury increased from 4.0% to 4.2% during the quarter. The Bloomberg Aggregate Index, representing a broad cross-section of the bond market, posted a -0.8% return for the first quarter. With signals that the Federal Reserve will hold off cutting rates for now, short-term bonds outpaced longer-term maturities. The Bloomberg Global Aggregate Bond Index ex-U.S. bonds was down 1.6%, but high yield bonds fared better, rising 1.6% due to the resilience of the U.S. economy.
The outlook for bonds continues to look rather bright, mainly due to the likelihood that the Fed is closer to the end of its rate hiking cycle, inflation is slowly coming down, and now bonds offer a respectable coupon rate after years of ultra-low interest rates. Bond coupon rates finally provide real competition for investment dollars versus stocks for more conservative income-oriented investors, given the more expensive investment profile of stocks.
Valuations
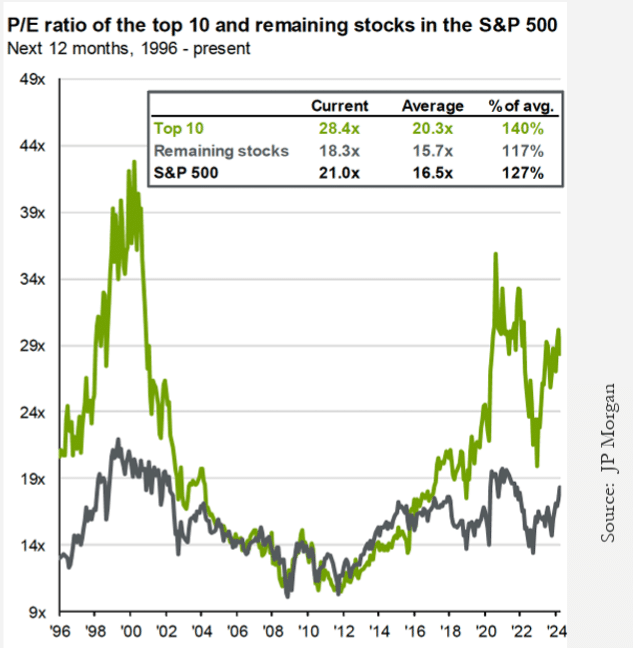
Despite very strong returns over the past six months, the outlook for stocks remains uncertain. This is because the Fed remains resolute in its battle against inflation, and valuations are stretched by historical standards. The projected P/E ratio of the S&P 500 ended the quarter at 21x earnings, vs. an average for the last 30 years of 16.6x (a 25% premium).
The earnings of the companies in the S&P 500, which only increased 4% last year, will need to pick up speed to justify current stock price to earnings multiples. Expensive valuations are especially true for the largest US companies. As seen in the following chart, the top 10 stocks in the S&P 500 are trading at a much higher level (140%) of historical valuation (projected price to earnings) levels than the rest of the market (at 117%).
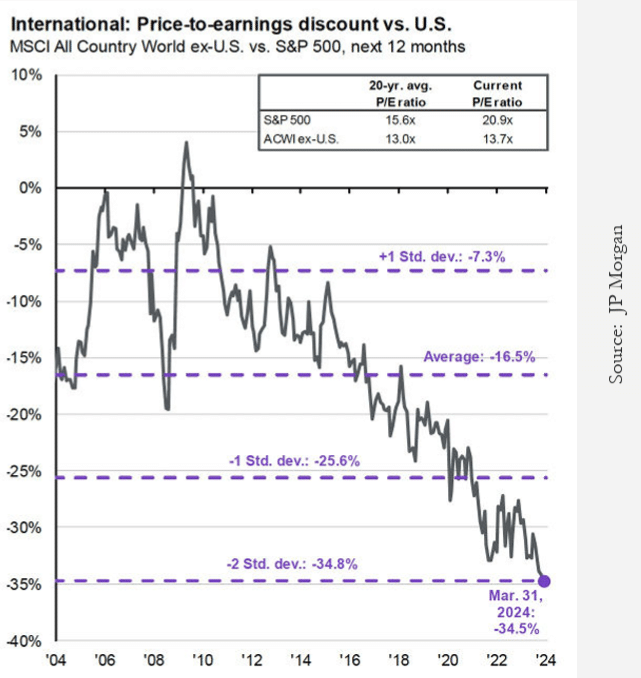
The second chart shows how the S&P is at particularly high valuation levels vs international markets, which are now trading at projected price-to-earnings levels that are close to historical norms but are 35% (or two full standard deviations) below that of the S&P 500—their lowest relative level in decades.
Ongoing Risks
There continue to be downside risks to the capital markets, which should be kept in mind as 2024 unfolds. Those risks include gridlock in a hyper-partisan Congress over essential issues like the federal budget, immigration, and funding conflicts regarding the wars in Europe and the Middle East. And we should remember the races for the Presidency and Congressional seats that are heating up. Presidential years tend to be positive years for equity returns (though past performance does not guarantee future results).
Historically the Federal Reserve has tended to avoid changing its monetary policy in any meaningful way as elections approach so as not to appear partisan. What was a forecast that the Fed might cut rates 6-7 times this year has turned into a more modest outlook on rate cuts, with perhaps only 2 or 3 cuts coming this year. But if inflation doesn’t come down soon, it is unlikely the Fed will cut rates as much as markets are expecting, if at all. Any combination of the above risks could disappoint investors.
Sources: YCharts, JP Morgan, Department of Labor, Department of Commerce, Bloomberg, Capital Market Consultants